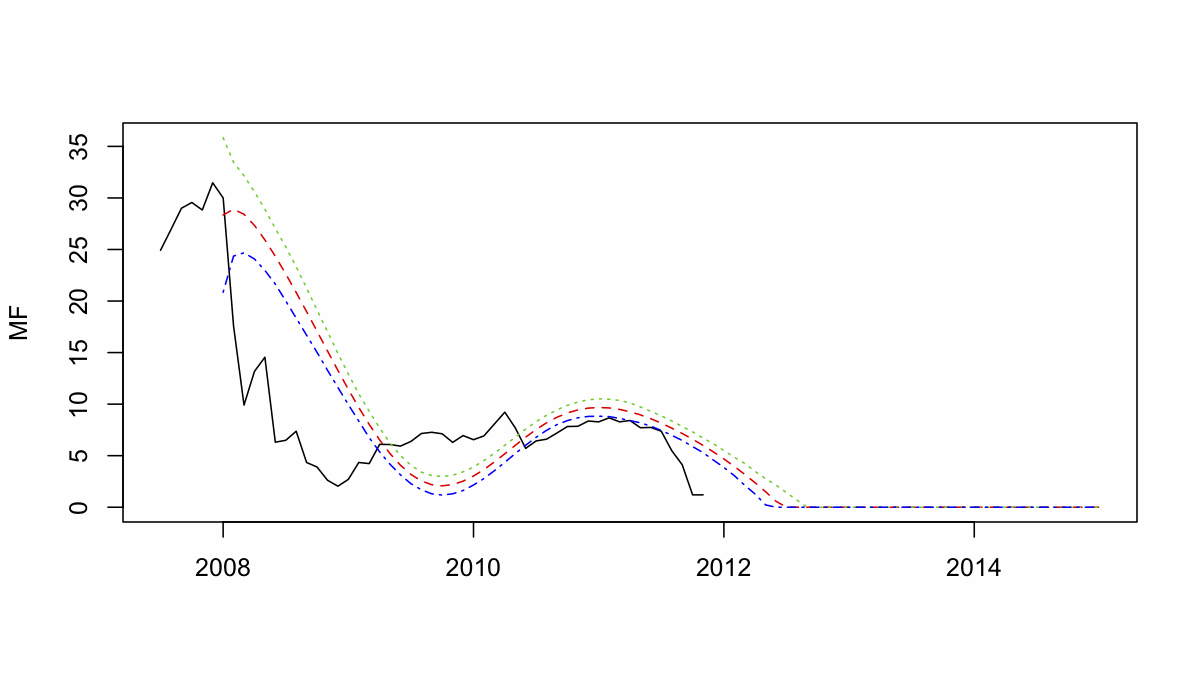
The Random Stock Walker is always interested in the collapse of Wall Street firms. When
MF Global declared bankruptcy this week, the event caught our attention. The primary question is "Could the collapse have been predicted by the stock's history?" Investors are always in the position of having really very little information about critical activities that might get a firm in trouble, the
unknown unknowns.
Someone out there in the market probably knows about the unknowns it's just not you, the individual investor.
Jim Cramer of CNBC makes the argument that the "smart money" is more likely to know and that since the smart money drives the market, retail investors have to comb through the entrails of stock prices, analyst statements and conference calls to figure out which way the smart money and thus the market is moving. In other words, there should be some evidence of impending collapse in historical stock prices.
The time plot above graphs the
dynamic attractor for MF Global (
MF). The attractor is primarily driven by the world economy and, what is more, the attractor is very sensitive to world oil prices. On the Google stock page (
here), MF global is described as a "...broker in markets for commodities and listed derivatives." The current description of "the trade that killed MF Global" (
here) involves are "repo-to-maturity" trade in EU sovereign debt. This may well be the
tipping point trade that brought down the house of cards but the Random Stock Walker models suggest that activities in the oil market would have eventually killed the firm also.

The reason that the Jefferies Group, an investment bank (
JEF), became involved in the MF Global collapse is that JEF was involved in the financing of the sovereign debt deal. As a result, JEF was downgraded by the
Eagan-Jones Rating Agency and
questions began to swirl around Jefferies. One of the questions involved "lack of transparency," those unknown unknowns again.
The Random Stock Walker attractor model shows a similar fate for JEF and a similar linkage to world commodity markets creating the collapse. Of course, it will be difficult to verify all this and it's only a statistical result. Regardless, there isn't really any reason for retail investors to be in either of these two stocks after the
2007 Financial Crisis.
 Spectrum Brands (SPB) is a global branded consumer products holding company located in Madison, WI. Spectrum is probably best know for the Rayovac Battery, Remington, Black & Decker and Faberware brands. Essentially, SPB acquires brands that have somewhat lost their consumer appeal, merges the brand within their infrastructure and, hopefully, resurrects the brand's image. This stock caught my attention because SPB just received a $4M forgivable loan from the Wisconsin Economic Development Corporation, a public-private partnership promoting the governor's "Wisconsin is Open for Business Message". The question is, was the money well spent? How long is it likely that the company will keep nearly 500 jobs at its corporate offices in Madison, WI (the reason for the forgivable loan)?
 SPB promotes itself as a global company. The graphic above shows the time plot of SPB's stock price. The dashed red line is the dynamic attractor driven by the world economy (the blue and green dashed lines are the 98% bootstrap prediction intervals). SPB emerged from bankruptcy in 2009 (here) and was re-listed on the NYSE. I not sure what to say about the company's future, but the stock price is heading for a crash. If the company follows the stock price then the 500 jobs are probably only good for another few years.