State Space Models

All state space models are written and estimated in the R programming language. The models are available here with instructions and R procedures for manipulating the models here here.

Thursday, November 3, 2011

The Collapse of MF Global and Maybe Jefferies

The Random Stock Walker is always interested in the collapse of Wall Street firms. When MF Global declared bankruptcy this week, the event caught our attention. The primary question is "Could the collapse have been predicted by the stock's history?" Investors are always in the position of having really very little information about critical activities that might get a firm in trouble, the unknown unknowns.

Someone out there in the market probably knows about the unknowns it's just not you, the individual investor. Jim Cramer of CNBC makes the argument that the "smart money" is more likely to know and that since the smart money drives the market, retail investors have to comb through the entrails of stock prices, analyst statements and conference calls to figure out which way the smart money and thus the market is moving. In other words, there should be some evidence of impending collapse in historical stock prices.

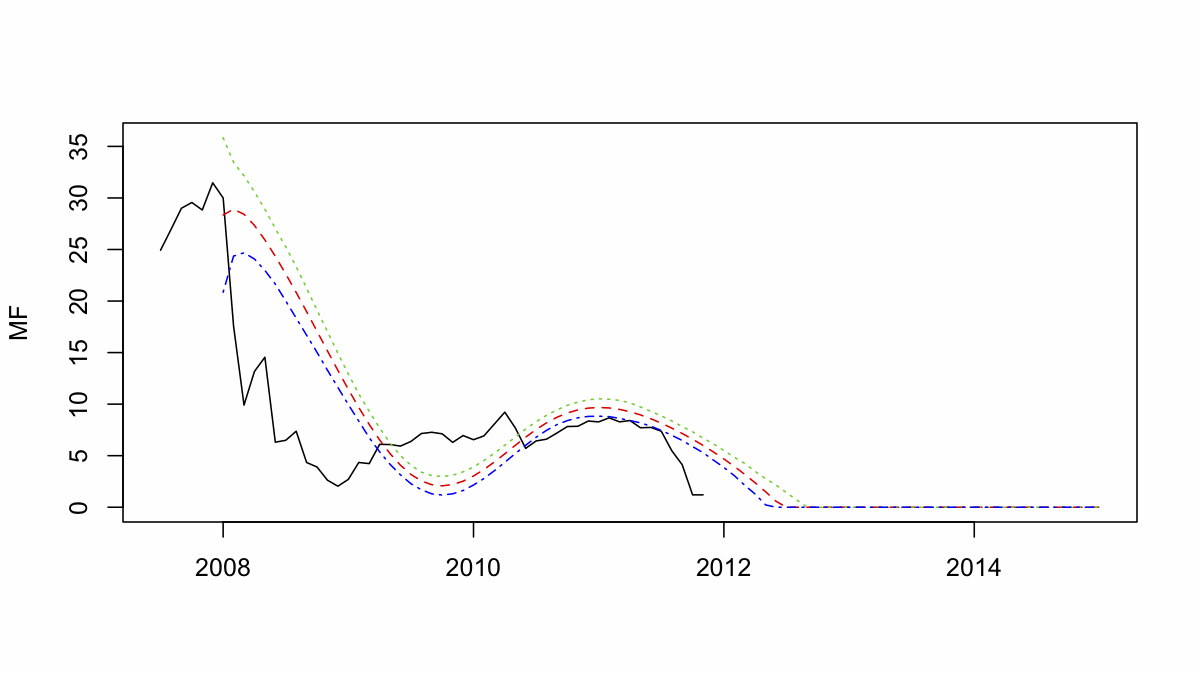
The time plot above graphs the dynamic attractor for MF Global (MF). The attractor is primarily driven by the world economy and, what is more, the attractor is very sensitive to world oil prices. On the Google stock page (here), MF global is described as a "...broker in markets for commodities and listed derivatives." The current description of "the trade that killed MF Global" (here) involves are "repo-to-maturity" trade in EU sovereign debt. This may well be the tipping point trade that brought down the house of cards but the Random Stock Walker models suggest that activities in the oil market would have eventually killed the firm also.
The reason that the Jefferies Group, an investment bank (JEF), became involved in the MF Global collapse is that JEF was involved in the financing of the sovereign debt deal. As a result, JEF was downgraded by the Eagan-Jones Rating Agency and questions began to swirl around Jefferies. One of the questions involved "lack of transparency," those unknown unknowns again.

The Random Stock Walker attractor model shows a similar fate for JEF and a similar linkage to world commodity markets creating the collapse. Of course, it will be difficult to verify all this and it's only a statistical result. Regardless, there isn't really any reason for retail investors to be in either of these two stocks after the 2007 Financial Crisis.

Sunday, September 25, 2011

When To Buy or Sell AAPL?

Apple Computer (AAPL) continues to do very well even after the departure of Steve Jobs. On the October 20th edition of Fast Money on CNBC, Carter Worth (chief market technician at Oppenheimer & Co) recommended doing what the hedge funds do: sell Apple when it breaks trend.
To determine trend, Worth suggested simply drawing a line along the low prices (see the solid red line above, the top graphic shows the moving average line in solid red) to establish trend. The graphic above compares the "trend selling" approach to the attractor bootstrap 98% prediction intervals for AAPL. The logic of attractor analysis would seem to be to take some money off the table anytime that a stock is above its attractor value and to definitely sell when the stock crosses the lower 98% prediction interval on the way down. You would buy in again either when the stock crossed the lower 98% prediction interval on the way up or when it bounced off the bottom (2009 for AAPL), if you can somehow tell where the bottom is.

In either approach, you would have been totally out of AAPL in late 2008 and buying back in (depending on the other uses of your money) until 2011 when you might have started taking some money off the table using attractor analysis. For the future, it's less clear that trend selling will work past the middle of 2012 when the trend line crosses the attractor.

It will be interesting to wait and see how each approach works about one year from now. It would also be interesting to compare how well these two approaches would have done in terms of a portfolio that invested $1000 at the bottom in 2009. The trick would be to decide what the portfolio's "other uses of money" might have been!

Tuesday, June 28, 2011

First Solar: A Good Test For Technical Analysis

In April (here) and November of 2010 (here) and again yesterday (here), analysts have been warning investors to short solar, particularly First Solar (FSLR). The consensus appears to be that political problems threaten solar subsidies, technological problems threaten existing production processes and competitive pressure is forcing the smart money to leave solar. Since the average investor can't beat the smart money, it's time to be short FSLR.

Reading the political, technical and market analysis is enough to make me queasy. Interestingly, my best forecast paints a different picture (with a lot of uncertainty). Watching FSLR over the next few years could be an interesting test case of whether statistical methods are adequate for investment analysis.
The graphics above displays my stock forecast for FSLR. The best model, selected using the AIC criteria, showed the FSLR stock price being driven by the state of the world economy. The forecast is for positive future growth.
The attractor model (displayed above) is also driven by the world economy and produces a similar forecast. The attractor model also suggests that the price peak in 2008 was driven by an investment bubble.

The problem with the forecast is that there is not much differentiation between competitor models (the random walk, the business-as-usual model or the models using FSLR volume or the state of the US economy as input variables). The confidence intervals around all the AIC statistics (created by bootstrap resampling) are all within the same range, 266 to 280. In other words, even though the AIC criteria will select a model, we can't be very sure it's the right model.

In spite of a positive forecast, the statistical results suggest not investing in FSLR simply due to uncertainty. It will be interesting to follow the stock and see where it goes over the next year.